

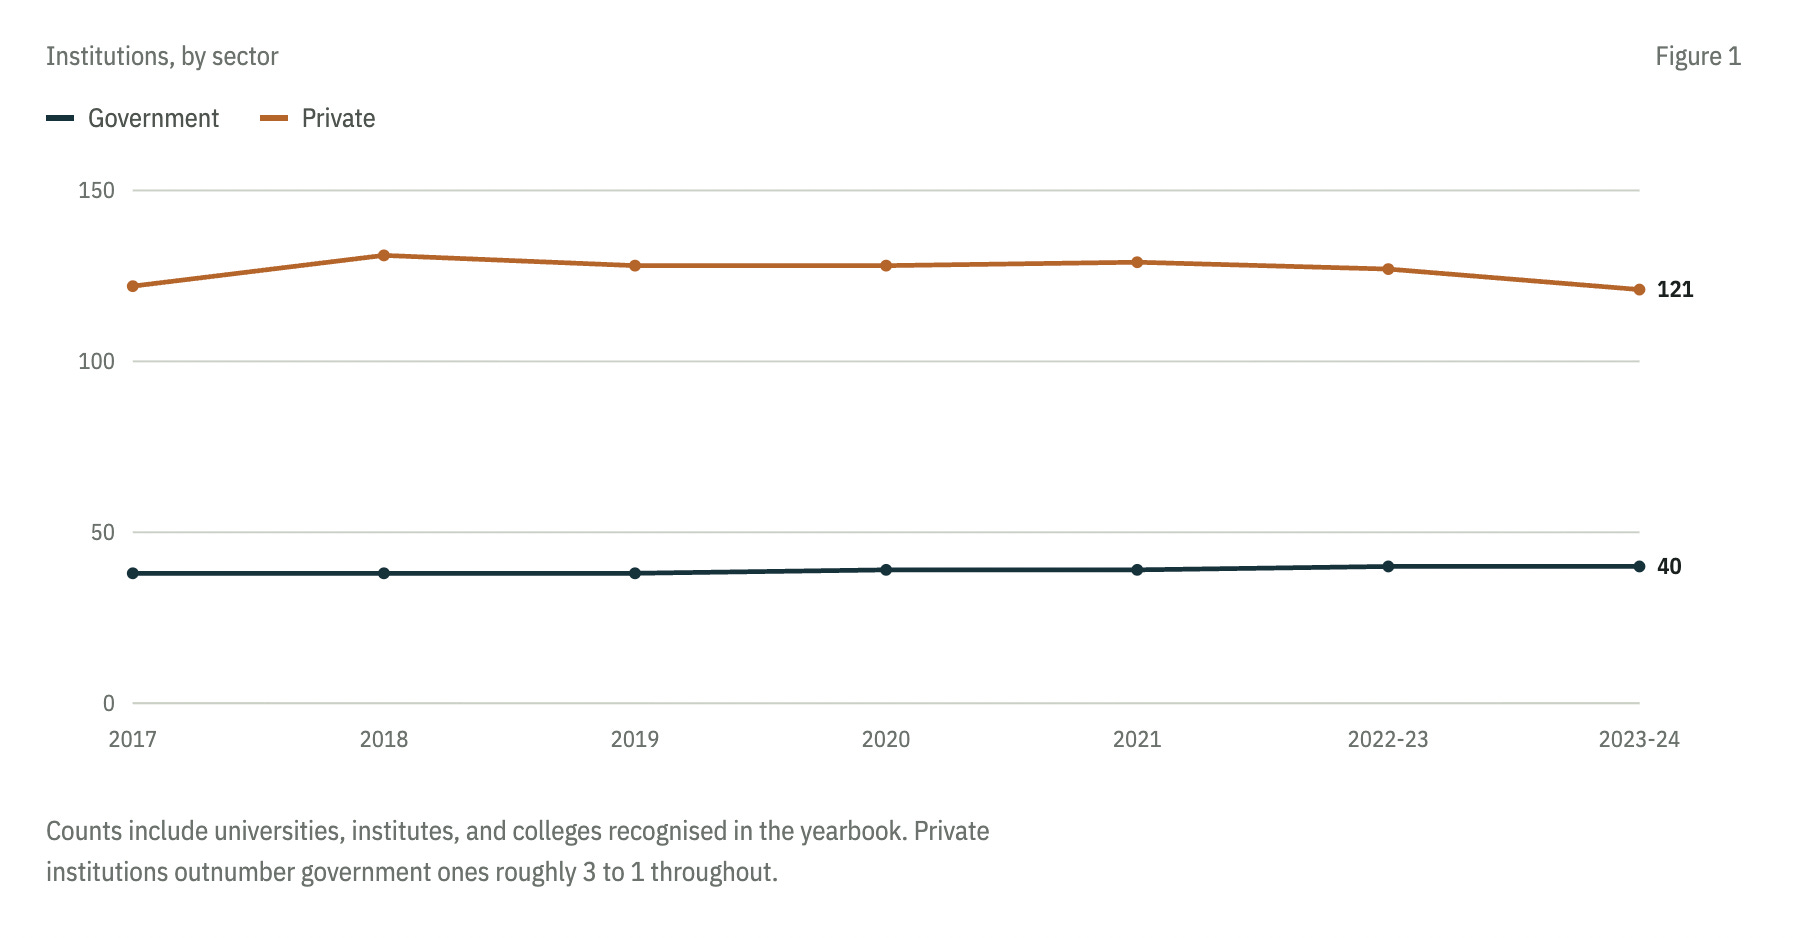
A statistics yearbook is written to reassure. Row after row, it counts what exists — institutions, faculties, staff — and a steady count reads as a steady system. By that measure, Afghanistan’s higher education system looks intact: 160 institutions in 2017, 168 by 2023–24, with no visible break even at the collapse of the government in 2021.
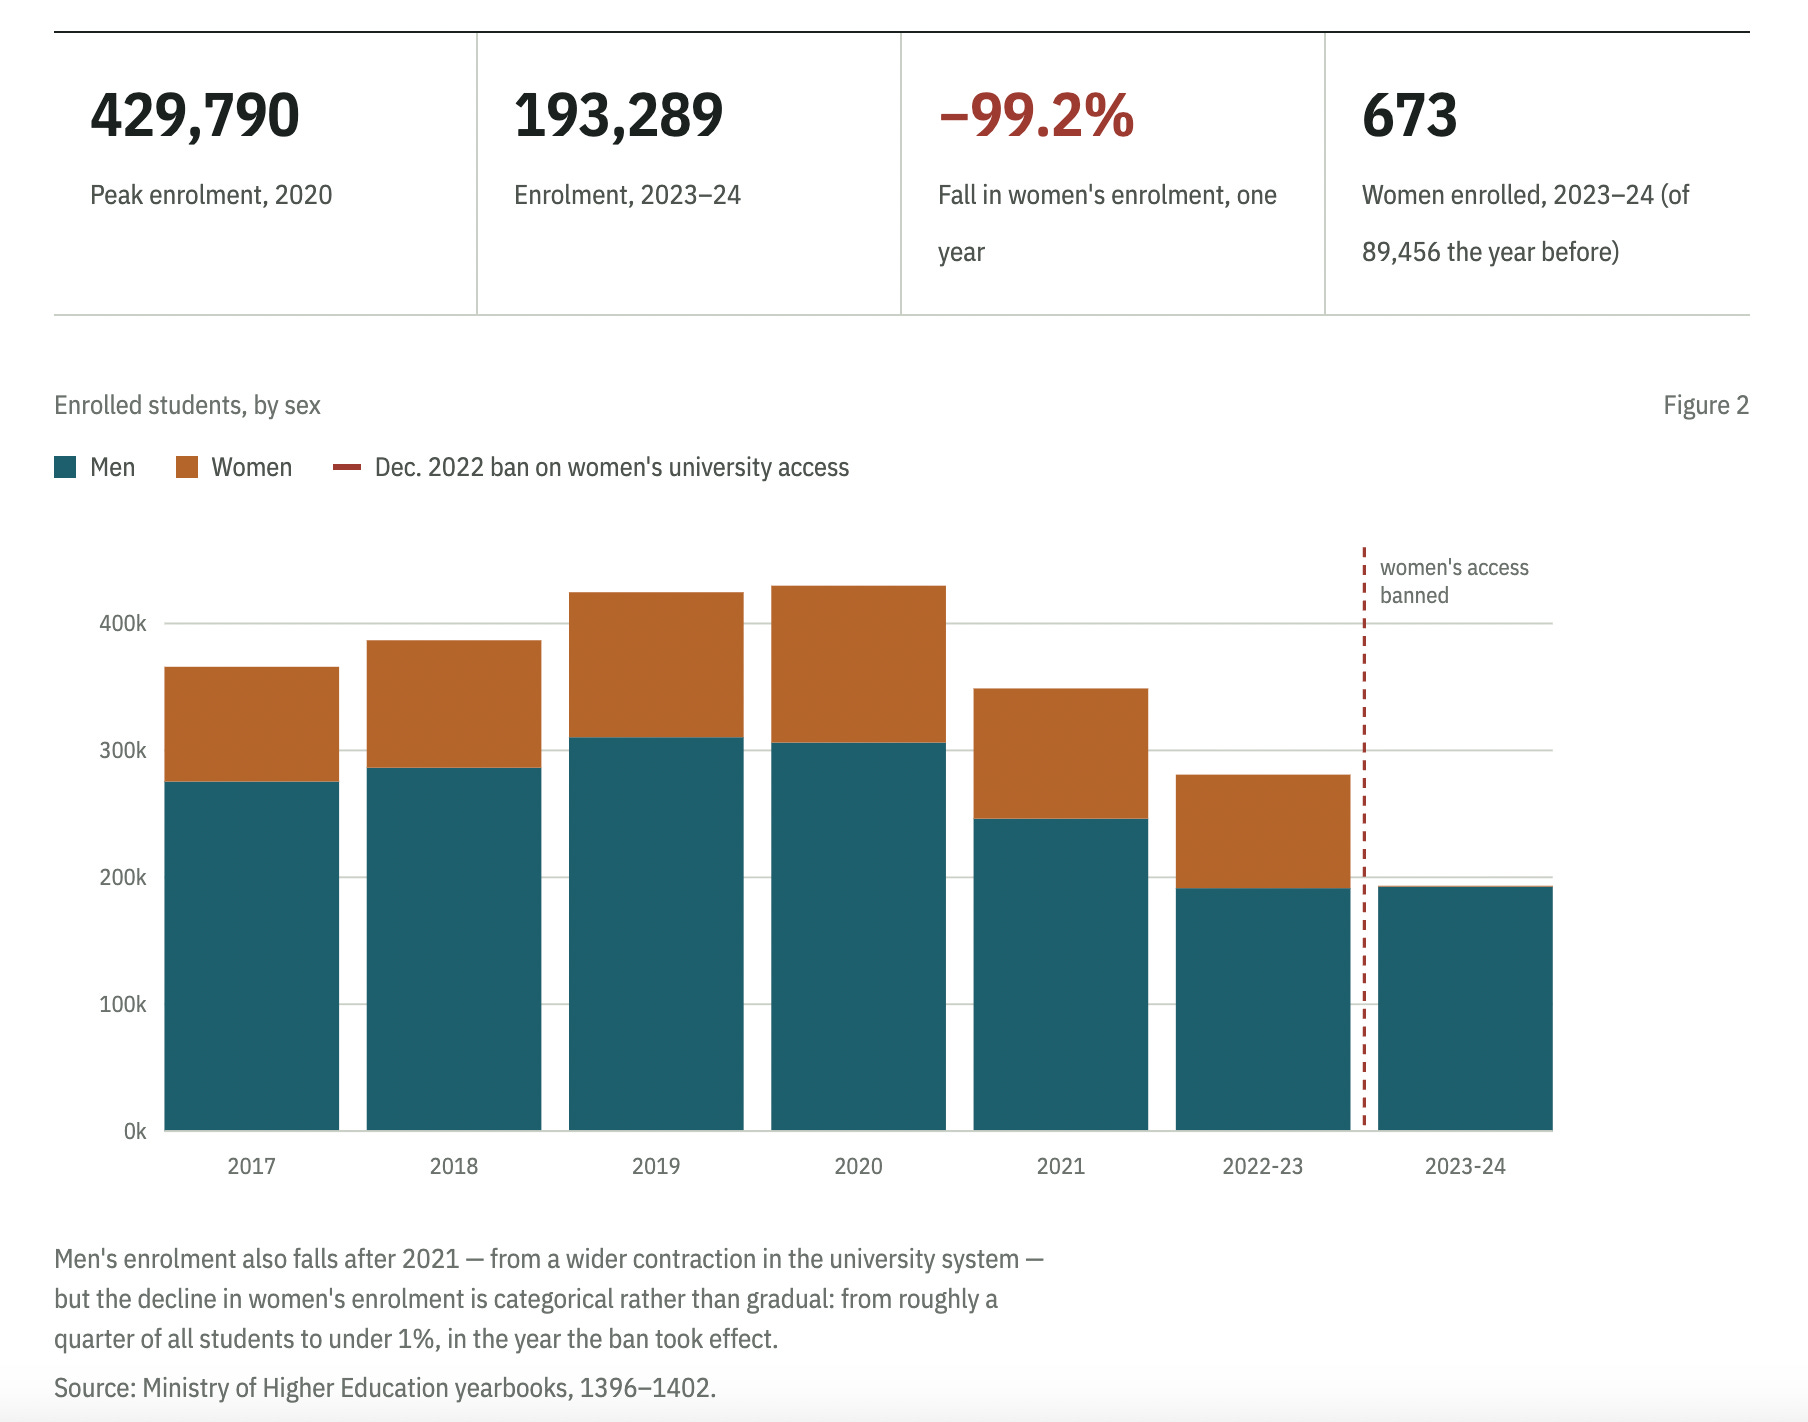
However, if you read the same yearbook against itself, a different system appears. Total enrollment fell for three consecutive years after 2020. Each year was worse than the last, leading to a final collapse that wasn’t just a continuation of that decline but a break in kind: women’s enrollment did not shrink; it was eliminated, dropping from 89,456 students to 673 in a single year. Faculty tell a similar story, with women’s teaching staff falling by half — and even that number overstates who remained in an actual classroom. Beneath a count that never wavered, almost everything the count was supposed to represent was falling.
This is what the institution number was never built to show. It counts buildings and charters, not what happens inside them. The pages that follow look beyond that number, into the ones the yearbook keeps but rarely highlights — enrollment, staffing, and who was still there to teach and be taught, year by year, through the years everything else was still called stable.
The number of higher education institutions kept moving, even as they began to empty
Higher education institutions remained steady since 2017, showing no signs of disruption even during the government’s collapse in 2021. However, beneath that stability, institutions started to struggle after 2021. They faced increasing pressure, and by 2025 and 2026, some had collapsed. The physical count is not where this story unfolds.
Then, in a single year, half the student body vanished
Total enrollment had grown almost every year until 2020. Then, it began an unbroken three-year decline with the collapse of the government. It fell by 18.8% in 2021, another 19.5% by 2022–23, and 31.2% more in 2023–24. Each year saw worse losses than a simple cooling, with the declines compounding well before women were removed from the count entirely. That final collapse was not just a continuation of the gradual decline; it was categorical, nearly eliminating one population from the system instead of just reducing it.
The teaching force shrank too, but unevenly by gender
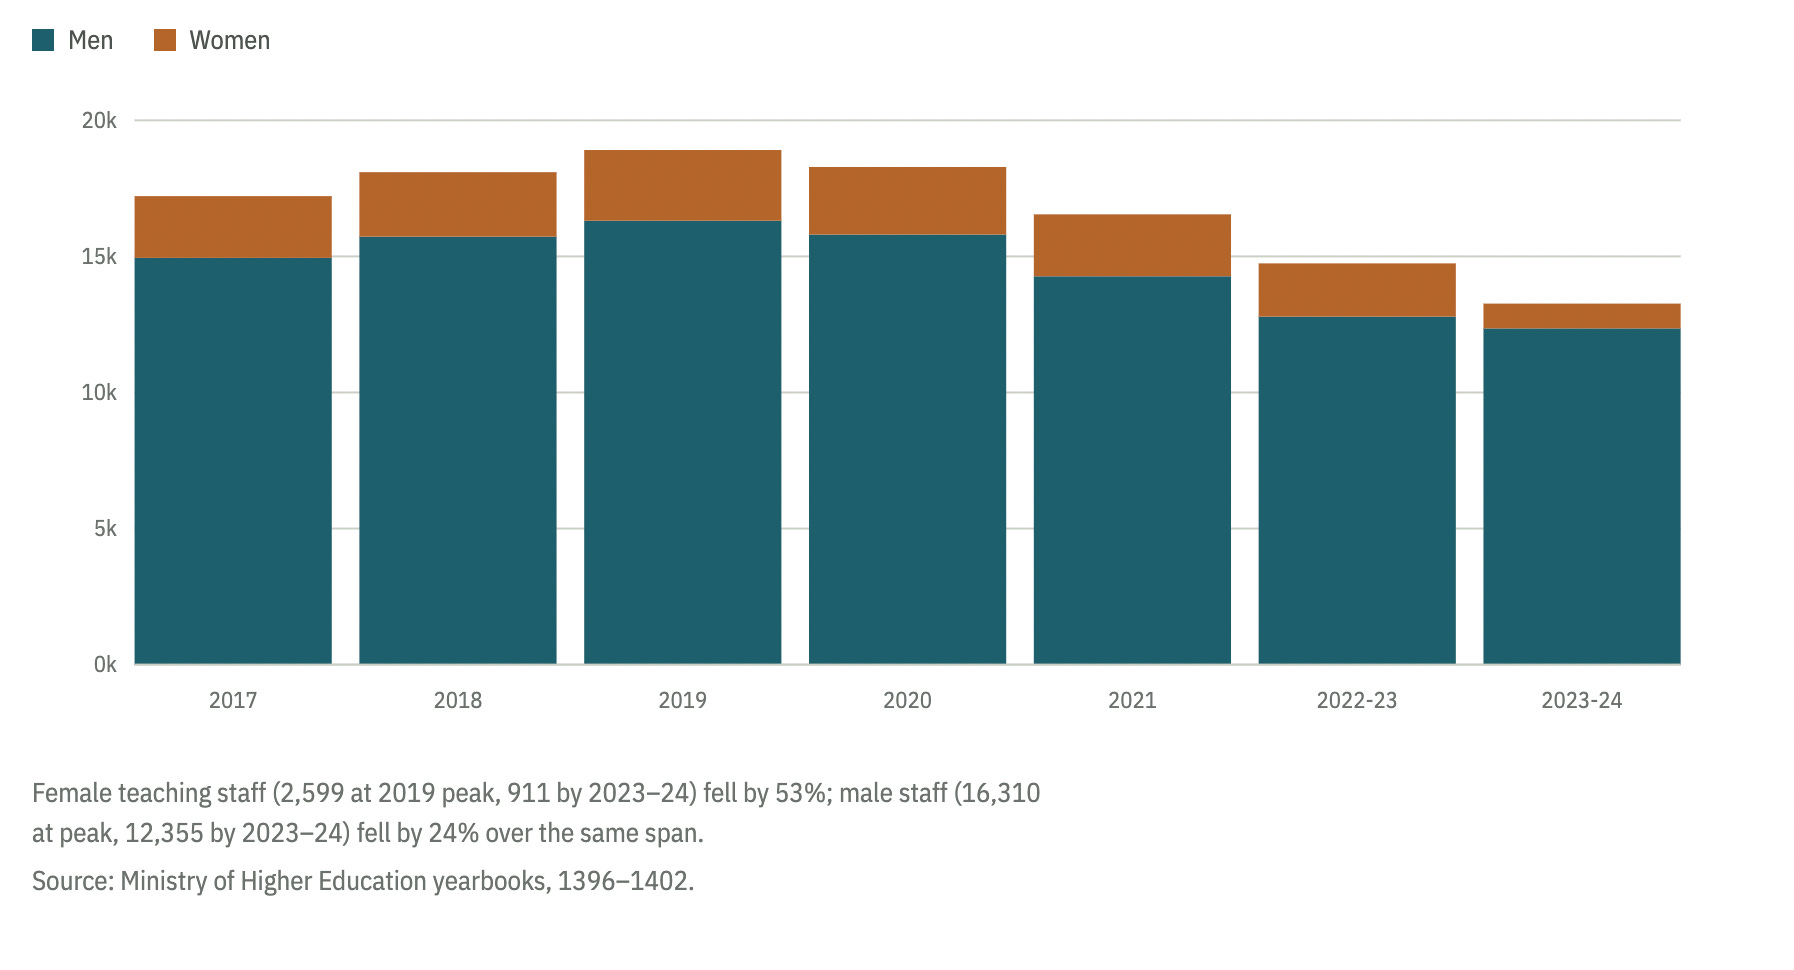
Faculty headcount peaked in the same year as enrollment, then declined with the government’s collapse and continued to fall into 2023–24. Male teaching staff dropped by about a third from their peak. Female staff fell by just over half, showing a steeper decline. The 2022 ban on women’s university education also applied to teaching, completely barring women from the classroom. The yearbook does not reflect this directly; it still lists 911 women on staff in 2023–24, down from 2,599. However, if the ban was enforced, that figure represents administrative records rather than women actually teaching.
Among ministry staff, the credential gap runs both ways
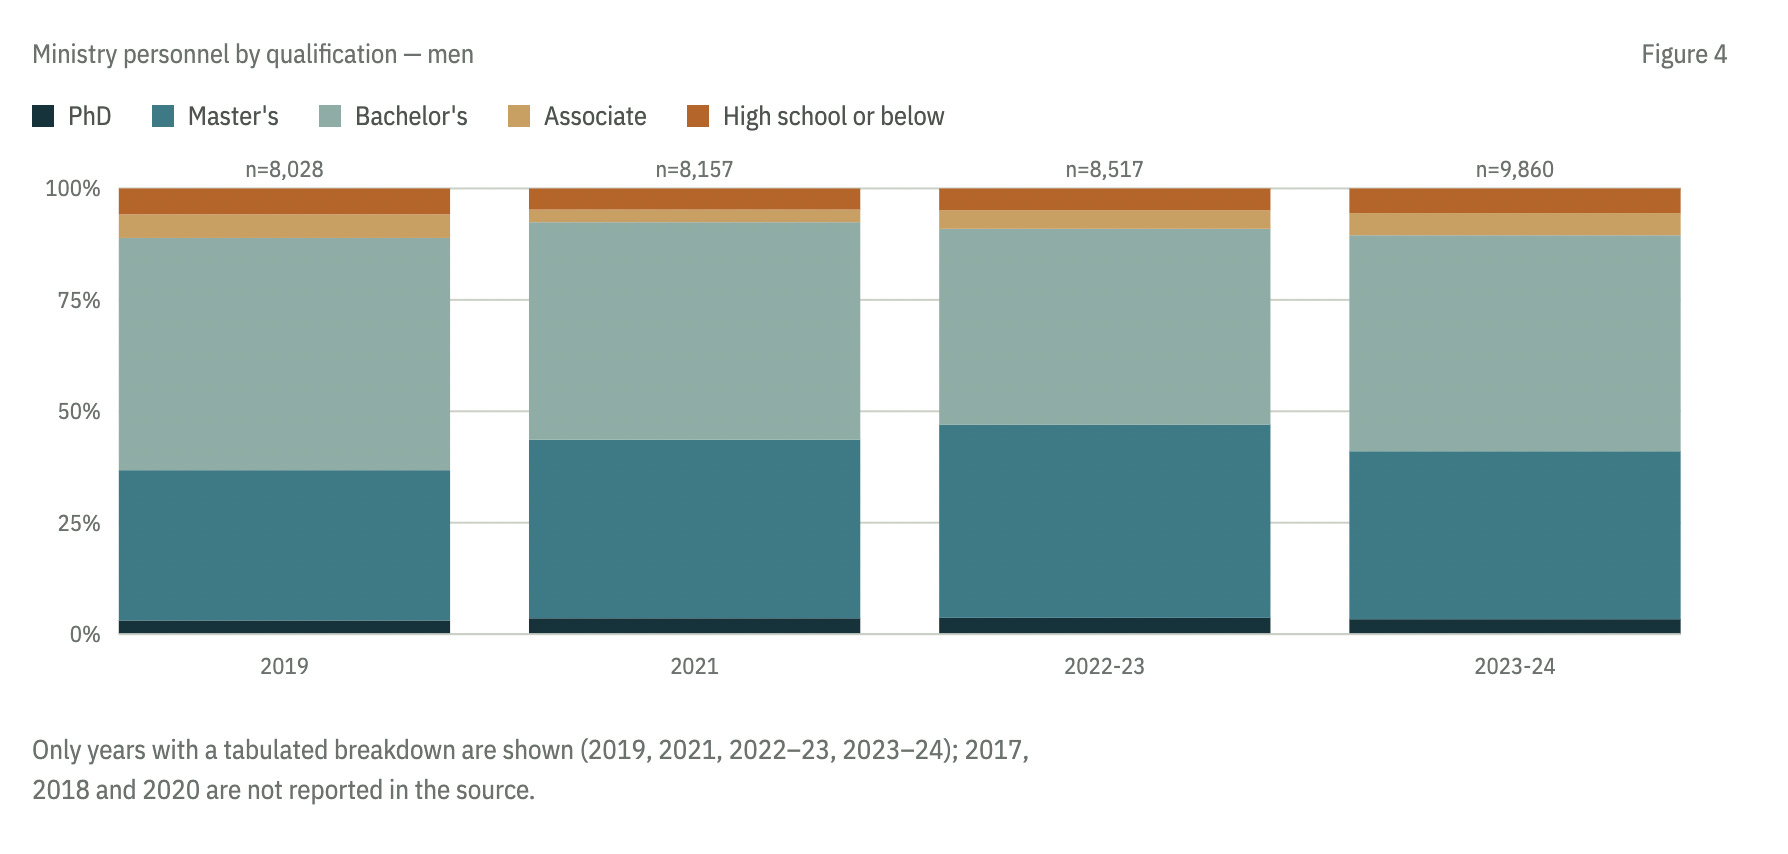
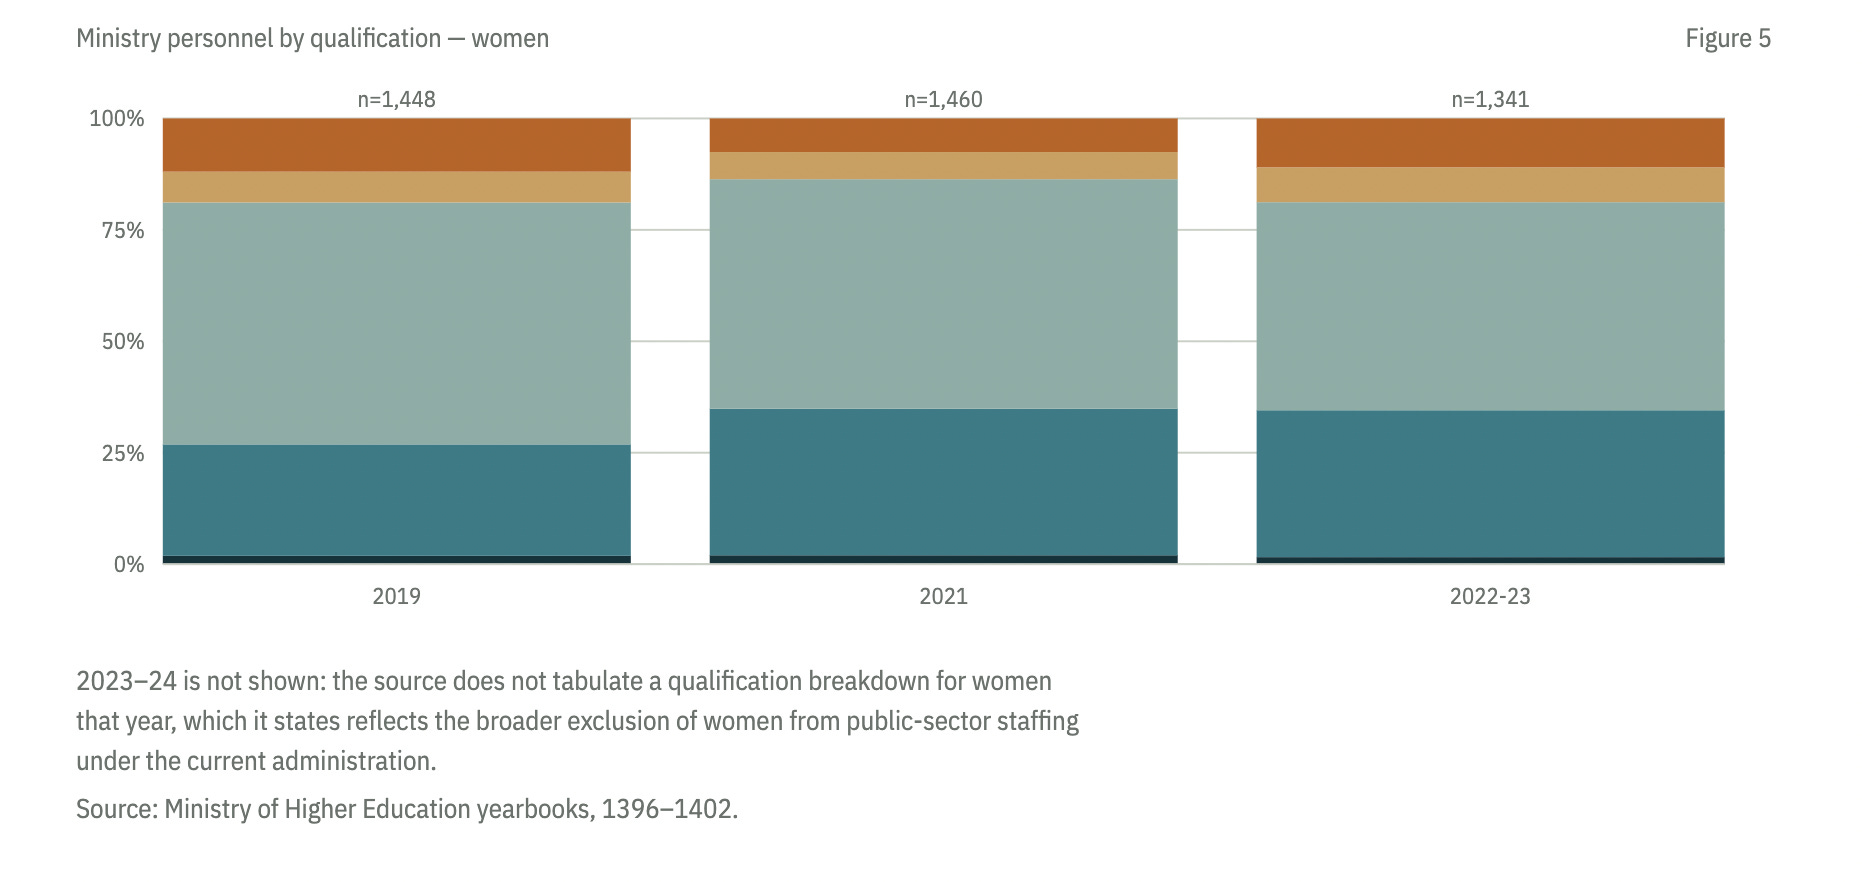
Where the yearbook lists staff qualifications — four of the eight years, and only three of those for women — men are consistently more likely to hold a doctorate. Women are consistently more likely to hold only a bachelor’s degree or less. Neither pattern changes much over the years available, but that apparent stability is misleading. These counts reflect who remained on staff, not who was present. After 2021, a significant number of academic staff with higher education — by some accounts over 1,000 — left the country entirely. Their departure is not visible in this data; it only shows the shrinking population that stayed, not the outflow that shaped it. Viewed this way, the “no movement” in the qualification tables is not continuity. It is what a collapsing pipeline looks like from the inside, after the people most able to leave have already done so.
Notes
All figures are drawn from Afghanistan’s higher education statistical yearbooks, solar years 1396–1402 (Gregorian 2017–2024), as transcribed into the accompanying workbook. Total and grand-total values in that workbook are formulas checked against the source’s own reported totals; every value charted here matches those totals exactly.