

Purpose and core argument
Nationally, Afghanistan’s teacher workforce appeared to be on track: 82.2% of its 224,904 teachers met the Grade 14 minimum in 2019. However, beneath that average lies a systematic sub-national inequality that neither national nor international metrics capture.
This fact base aims to support future research. It outlines, province by province and region by region, where teacher qualifications are concentrated and where they are lacking, as well as the size of the gaps. It directs researchers to the areas that need the most attention and enhances the current understanding of sub-national disparities.
Three claims run through it:
The national average is a misleading summary. A headline of 82% qualified teachers obscures provinces where fewer than half meet the minimum.
The disparities are systematic, not random. They follow a geographic pattern: a low-qualification belt across the south, southeast, and west, contrasted with a well-qualified north and Kabul corridor.
Different measures reveal different inequalities. Gaps in minimum qualifications are mainly regional, while degree-level gaps are primarily provincial. A single indicator cannot capture both.
This pattern is not unique to teachers. The same divergence between a promising national picture and uneven sub-national outcomes is evident in Afghan education more broadly, including gender parity in access, school buildings, resource allocation, retention, and graduation rates. Teacher qualification is one clear, measurable example of this issue.
Policy context
Teacher qualification has been a clear national priority for two decades (2002 - 2021) during the Republic era. This makes Afghanistan a strong case for examining how well equity goals were achieved.
Teaching quality and learning. The education level of teachers is closely linked to the quality of their teaching. Higher education gives teachers the subject knowledge and classroom skills they need. Quality teaching is a core pillar of quality education under SDG 4.
The Grade 14 standard. National teacher education policy requires that every teacher has at least two years of teacher college education (Grade 14) in their professional area.
Equity in national plans. All three National Education Strategic Plans emphasized equality in teacher education alongside the Grade 14 requirement.
Human capital and stability. National strategies for peace and economic development view human capital as a main pillar. Schools are seen as a key producer of it. Therefore, teaching quality and teacher education are directly linked to national priorities.
Sustained international support. The education sector received significant international assistance during this period.
With this policy outlook, the questions this fact base answers are:
How well was the Grade 14 goal achieved nationally?
How evenly was it achieved across provinces and regions?
Which provinces and regions performed better, and which performed worse?
How large are the gaps, and are they regional or provincial?
Data and Measures
This analysis utilizes teacher data sourced from the 2019 Education Management Information System (EMIS) across all 34 provinces. A total of 224,904 teachers are included in this analysis, covering the 34 provinces and eight regions for educational levels ranging from below Grade 12 to Grade 12, Grade 14, and BA and above.
Measures used:
Qualified share: The percentage of Grade 14 and BA+ teachers among all teachers.
BA+ share: The percentage of teachers with a bachelor’s degree or higher among all teachers.
Gap and ratio: The difference and ratio between the highest and lowest provinces.
Coefficient of variation (CV) and Gini: The spread and inequality across provinces.
Theil decomposition: This breaks down inequality into parts between regions and within regions, weighted by the number of teachers.
Cramér’s V: The effect size showing how much the education mix varies across regions and provinces.
Finding 1. The national picture: most teachers meet the minimum, few hold degrees
In 2019, more than four out of five teachers met the Grade 14 minimum, while fewer than one in five did not. Holding a degree was the exception rather than the norm: about three in ten teachers had a BA or higher, while just over half stopped at Grade 14, which is the minimum. Around one in six had only completed Grade 12, and those below Grade 12 were a small group of fewer than one in fifty.
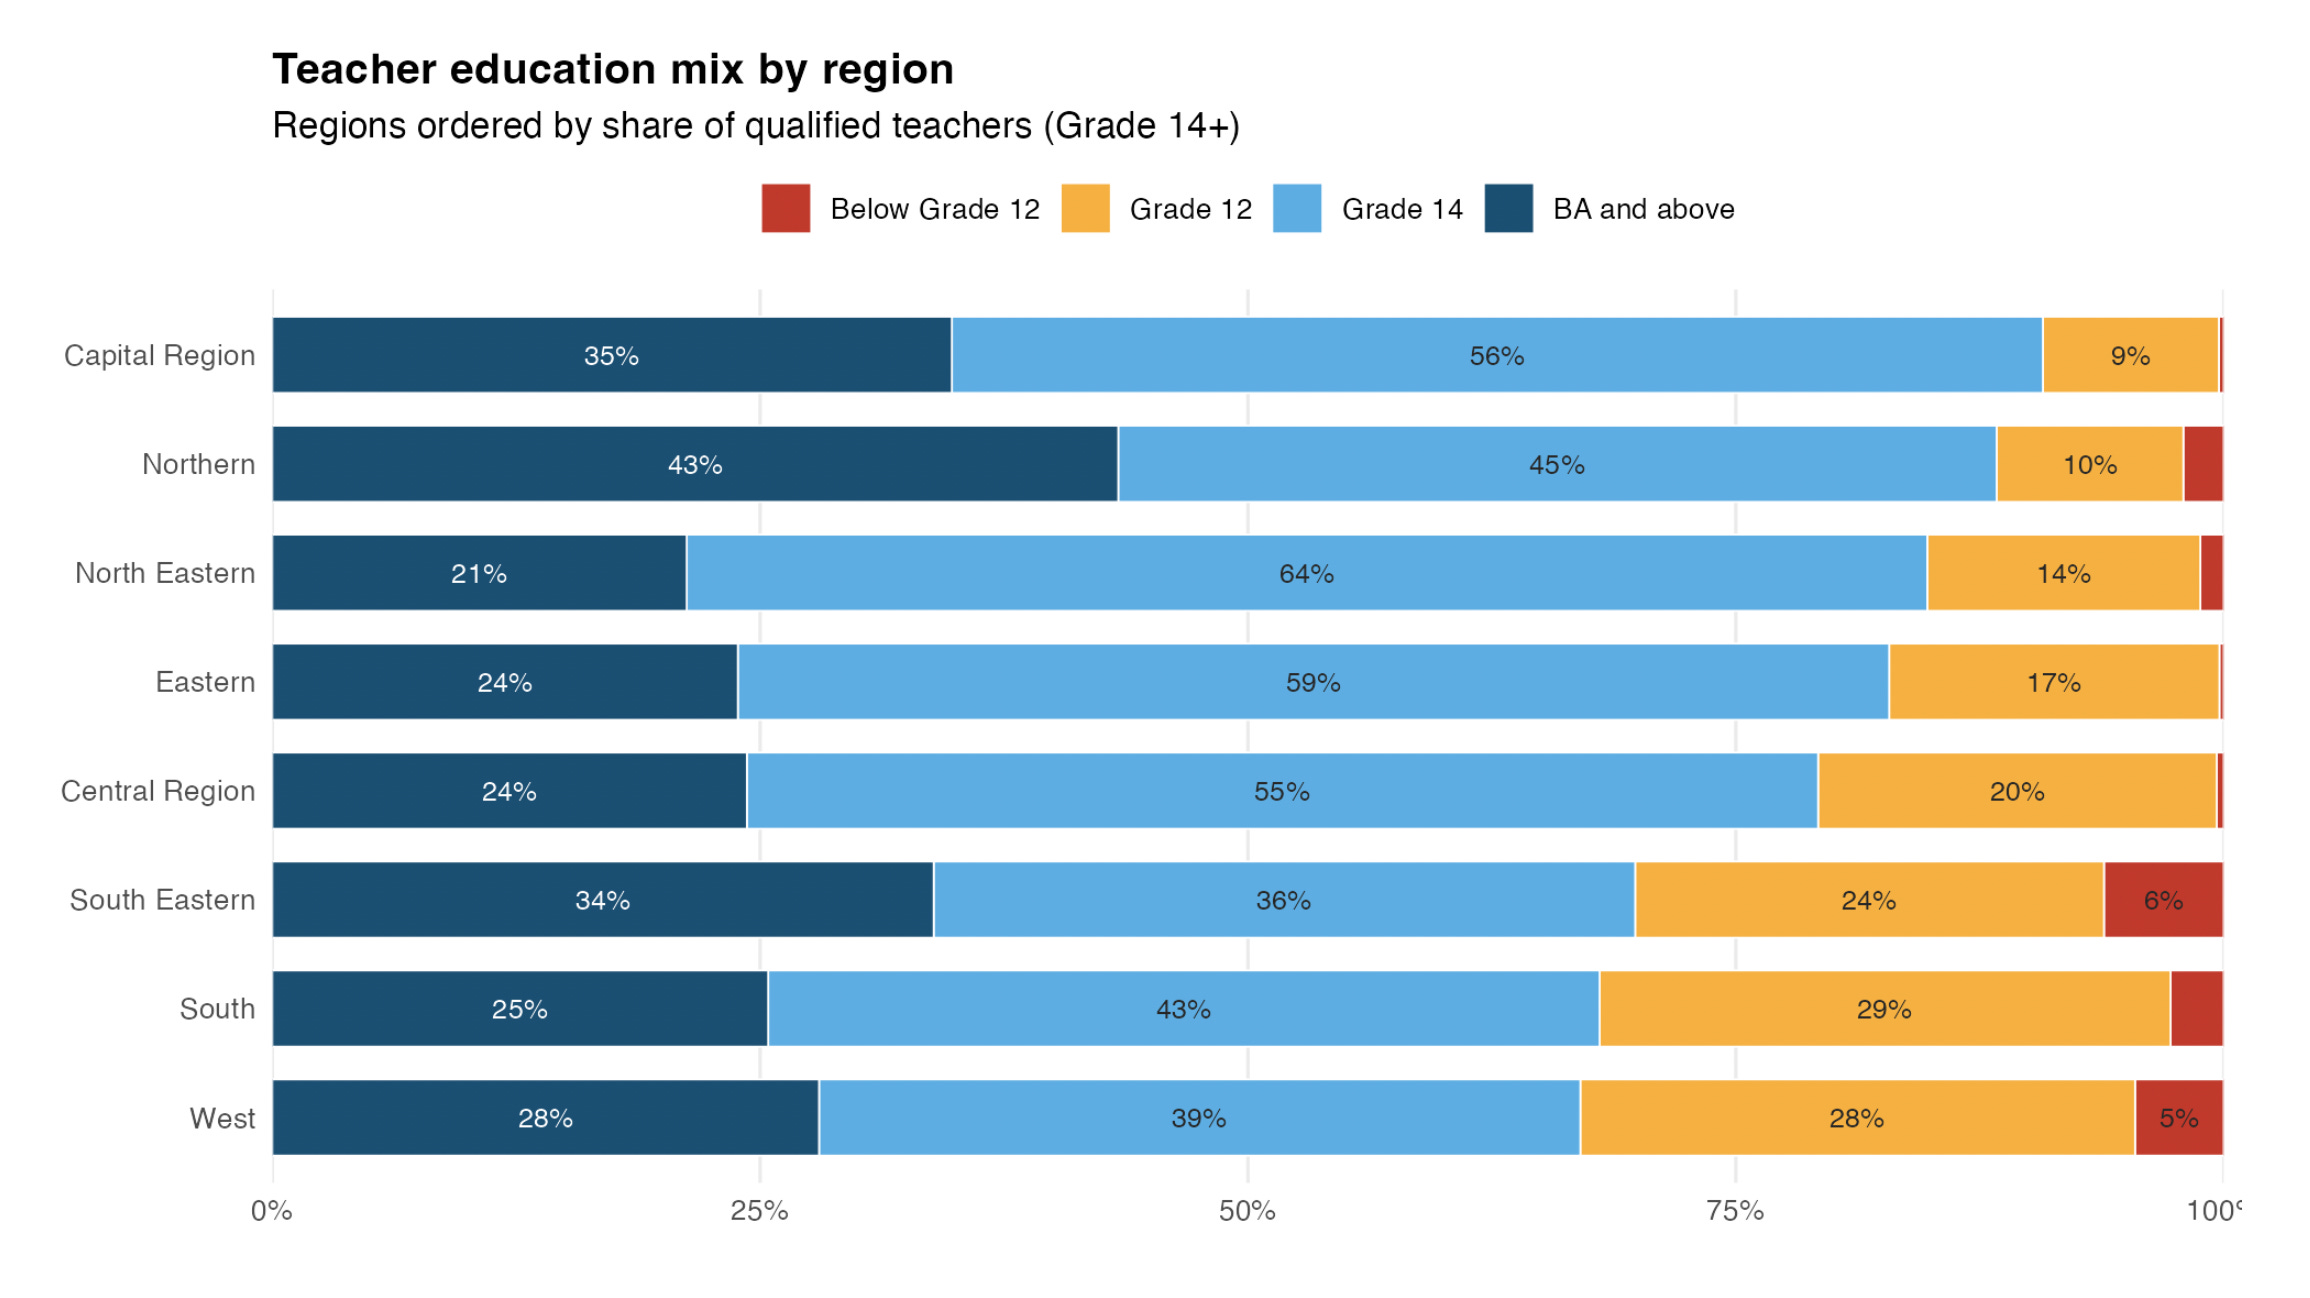
Figure 1. Distribution of Teacher Education by Region. Source: EMIS 2019; author’s analysis.
Grade 14 was the standard qualification. Most qualified teachers had the minimum requirement rather than a degree.
Nine out of ten unqualified teachers were Grade 12 graduates. Teachers below Grade 12 represented a small group.
By international standards, this appeared successful. A system-wide figure of over four in five teachers meeting the national standard is what national and international reports typically highlight. However, the findings that follow reveal what this figure overlooks.
Finding 2. A well-qualified north and Kabul corridor, and a low-qualification south-west belt
Only half of the eight regions met the national average. In six provinces, about half or more of the teachers did not meet the minimum qualifications.
The Capital, Northern, North Eastern, and Eastern regions were at or above the national average. The Central region was just below it, while the South Eastern, South, and West regions lagged significantly, with only about two out of three teachers qualified.
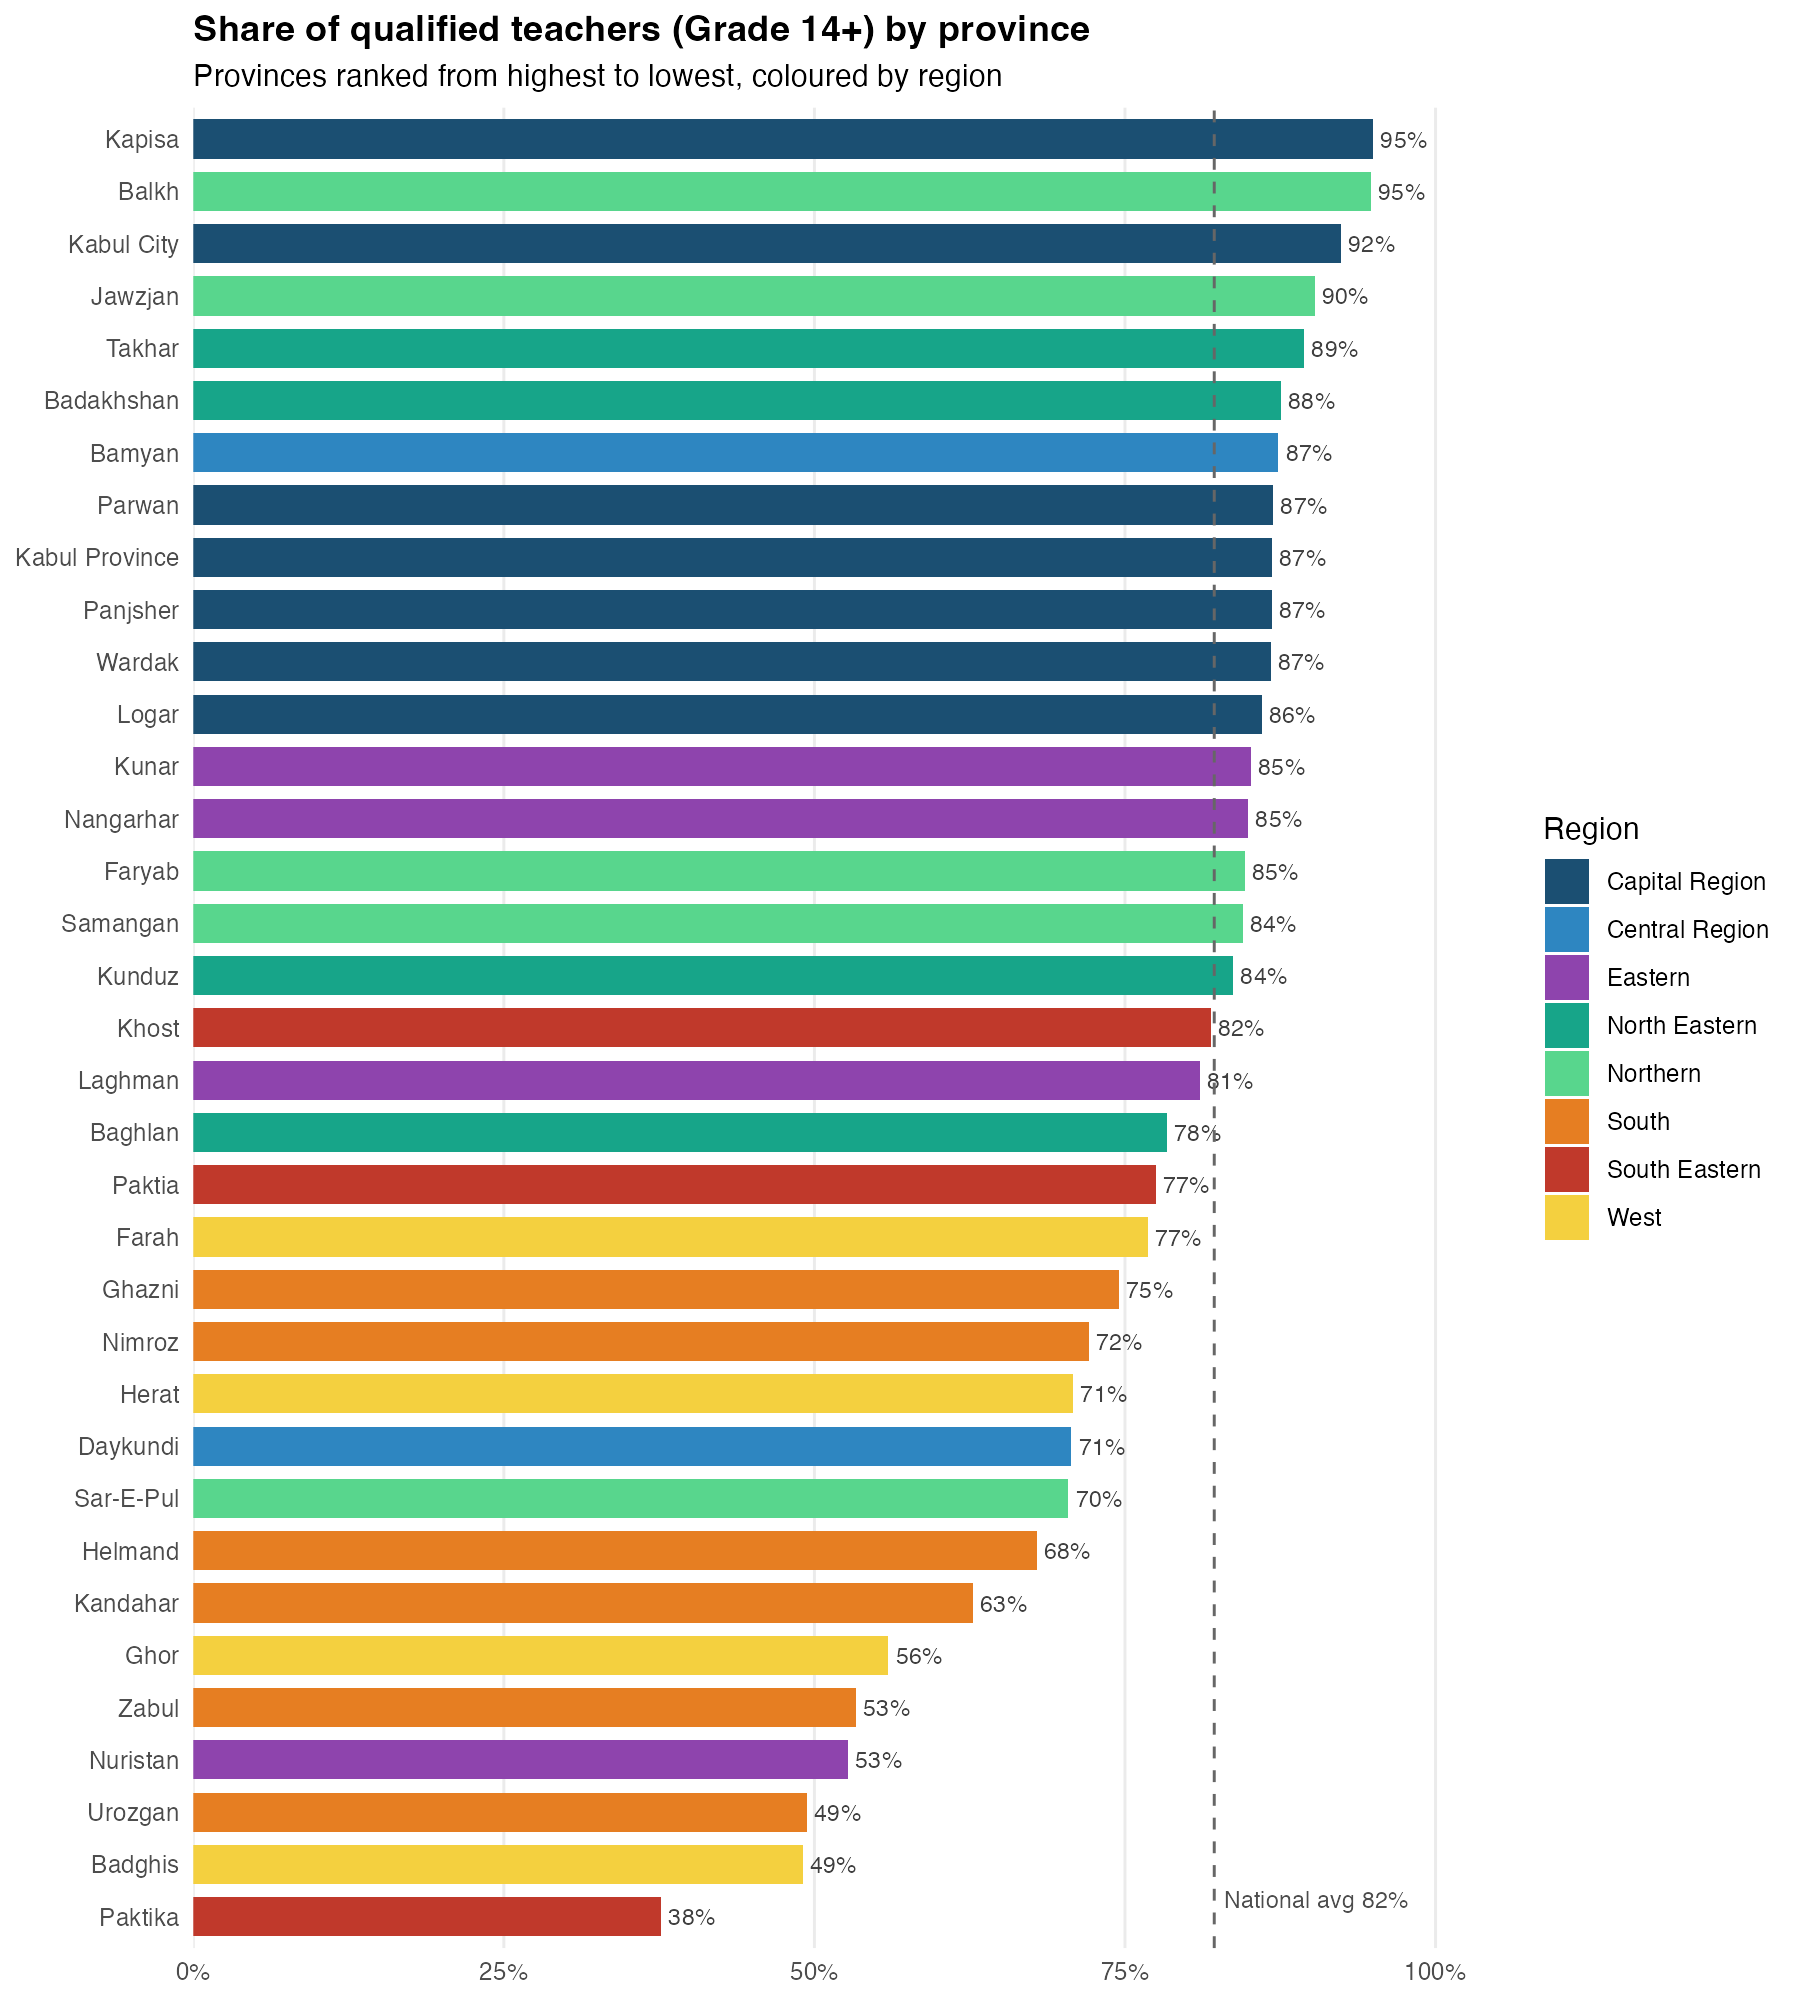
Figure 2. Share of qualified teachers (Grade 14+) by province, ranked and colored by region; dashed line represents the national average. Source: EMIS 2019; author’s analysis.
Where qualifications are highest
Qualified share: Kapisa 95.0%, Balkh 94.8%, Kabul City 92.4%, Jawzjan 90.3%, Takhar 89.4%.
BA+ share: Balkh 51.0%, Jawzjan 49.0%, Khost 41.8%, Kabul City 40.7%, Faryab 39.4%.
Kabul City dominates in volume. It has 43,703 teachers, which is 19% of the national workforce. It also accounts for about 26% of all BA-level teachers. The Capital Region as a whole holds 30% of all teachers.
Where qualifications are lowest
Qualified share: Paktika 37.7%, Badghis 49.1%, Urozgan 49.4%, Nuristan 52.7%, Zabul 53.3%, Ghor 56.0%.
The weakest regions (West, South, South Eastern) are 12 to 15 percentage points below the national average.
A continuous belt. When mapped, the low-qualification provinces form a band from Badghis and Ghor in the west, through Urozgan and Zabul, to Paktika in the southeast.
Paktika is an outlier. Fewer than 4 in 10 of its teachers are qualified. It also has the most teachers below Grade 12 (768) of any province.
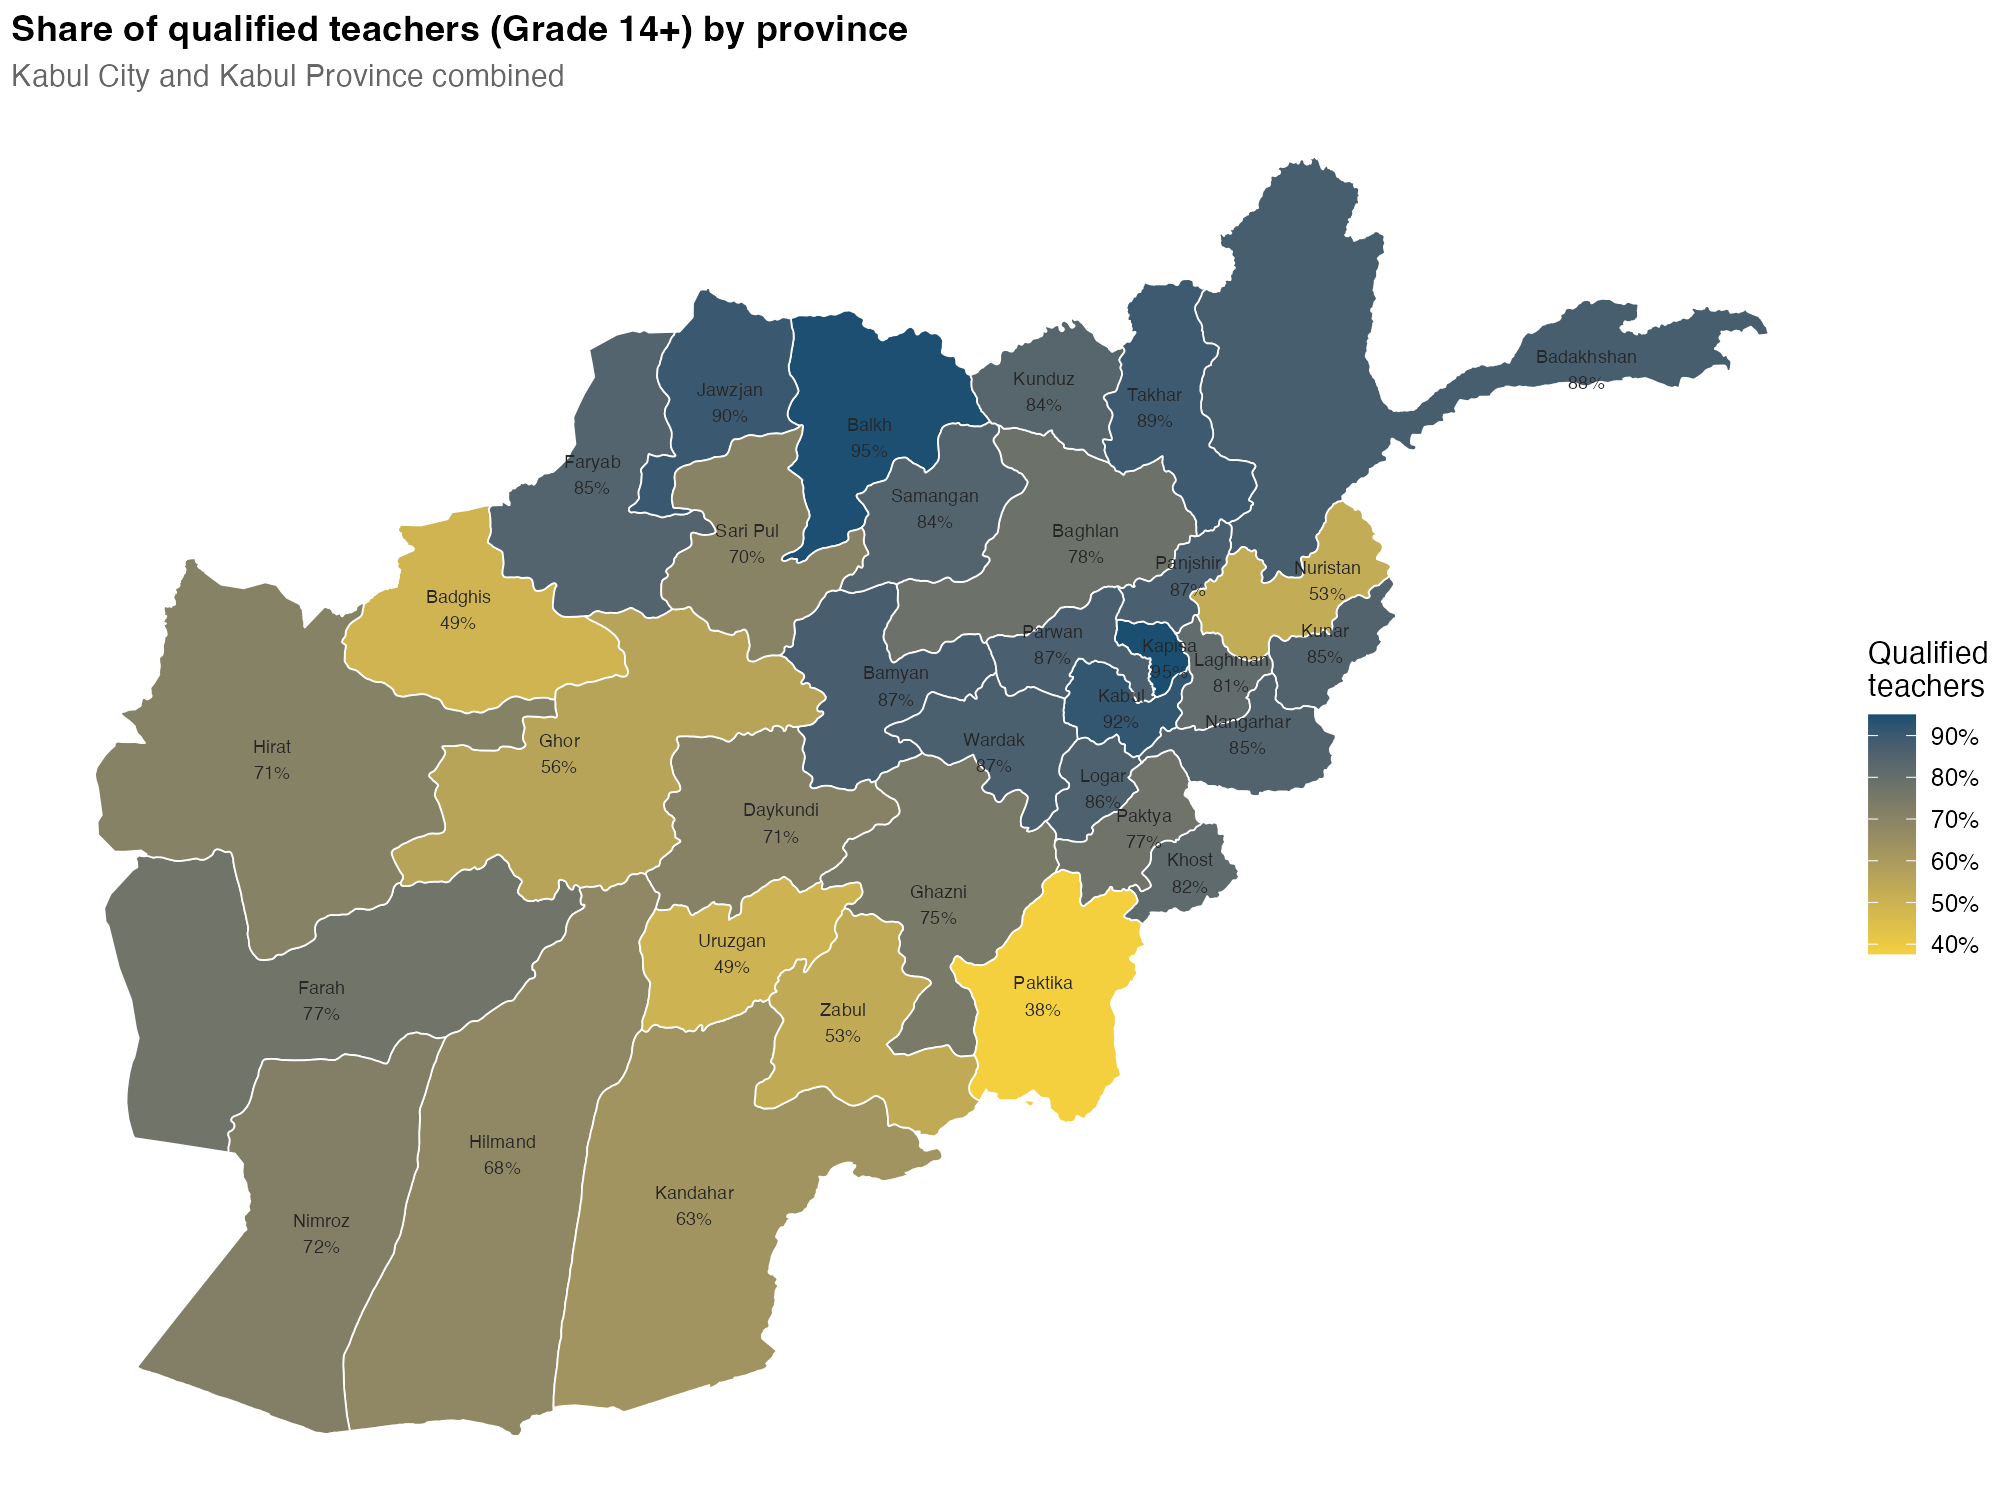
Figure 3. Percentage of qualified teachers (Grade 14+) by province, including Kabul City and Kabul Province. Source: EMIS 2019; author’s analysis.
Finding 3. The gaps are large, and far larger for degrees than for the minimum
The best-placed province had two and a half times the qualified share of the weakest province. It also had thirteen times the share of degree holders.
In Kapisa, nearly all teachers were qualified. In Paktika, fewer than four in ten were qualified, creating a gap of almost sixty percentage points. In Balkh, half of all teachers held a degree, while in Nimroz, fewer than one in twenty-five did.
Degrees are far more unequally spread than the minimum. The Gini coefficient for BA+ is 2.6 times that for the qualified share. Most provinces have achieved broad Grade 14 coverage, but degree holders are concentrated in a few areas.
The spread is moderate overall. The coefficient of variation is 0.192. Most provinces have between 65% and 90% qualified teachers, with a long tail below that range.
Province matters more than region. Cramér’s V is 0.171 across regions and 0.263 across provinces. Regional averages therefore mask significant provincial differences.
Finding 4. Two kinds of inequality: regional for the minimum, provincial for degrees
The Theil decomposition showed that the two measures followed different geographies and required different responses.
For minimum qualifications, well over half of the inequality was between regions. For degrees, the pattern reversed: about two-thirds of the inequality was within regions, between neighboring provinces.
Minimum-qualification gaps are regional. The South, South East, and West fall behind as a block. Region-level programs would address most of this gap.
Degree gaps are provincial. Every region has a high-BA hub next to low-BA neighbors:
Balkh (51%) sits beside Samangan (24%) in the North; Kandahar (36%) is next to Nimroz (4%) in the South; Herat (36%) is beside Badghis (11%) and Ghor and Farah (12%) in the West; Nangarhar (30%) is next to Nuristan (5%) in the East; and Khost (42%) is beside Paktika (17%) in the South East.
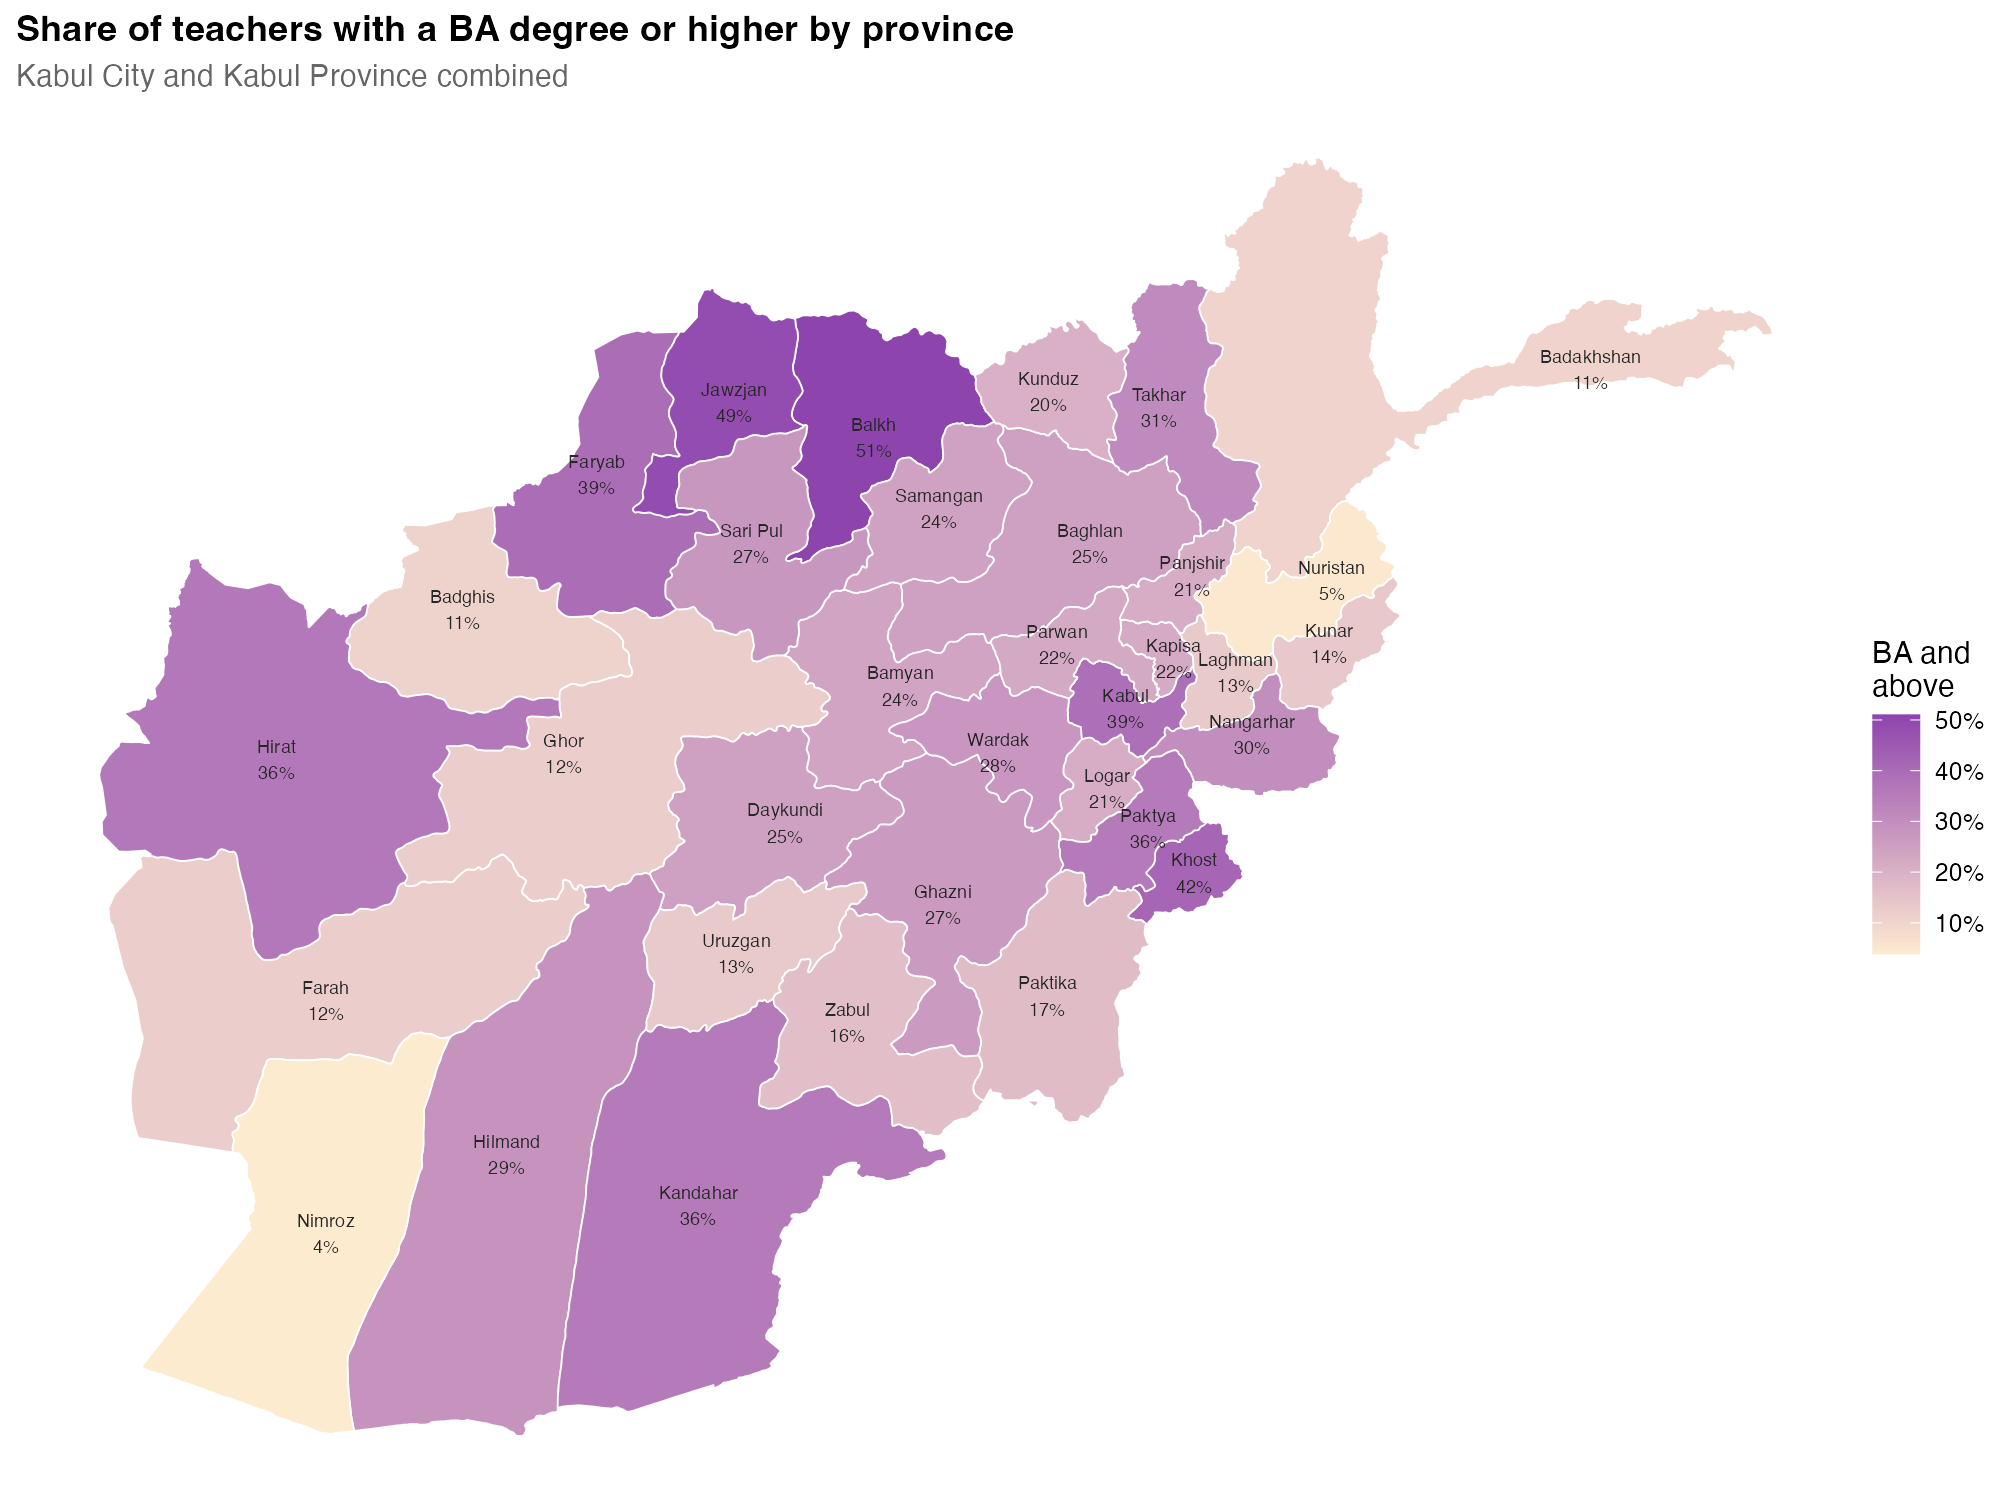
Figure 4. Percentage of teachers with a BA degree or higher by province, including Kabul City and Kabul Province. Refer to Figure 3 for broad regional categories for the minimum and scattered provincial centers for degrees. Source: EMIS 2019; author’s analysis.
Finding 5. Regional averages hide uneven regions and very different provincial profiles
Some regions were nearly uniform, while others had provinces at opposite ends of the national ranking. The provinces in the Capital Region were close in their scores, while the South East covered almost the entire national range.
The South East, East, and West were the most uneven. In each of these regions, one province had more than three-quarters of its teachers qualified, while a neighboring province had about half or fewer. The South and North were moderately uneven, while the Central and North Eastern regions were the least uneven.
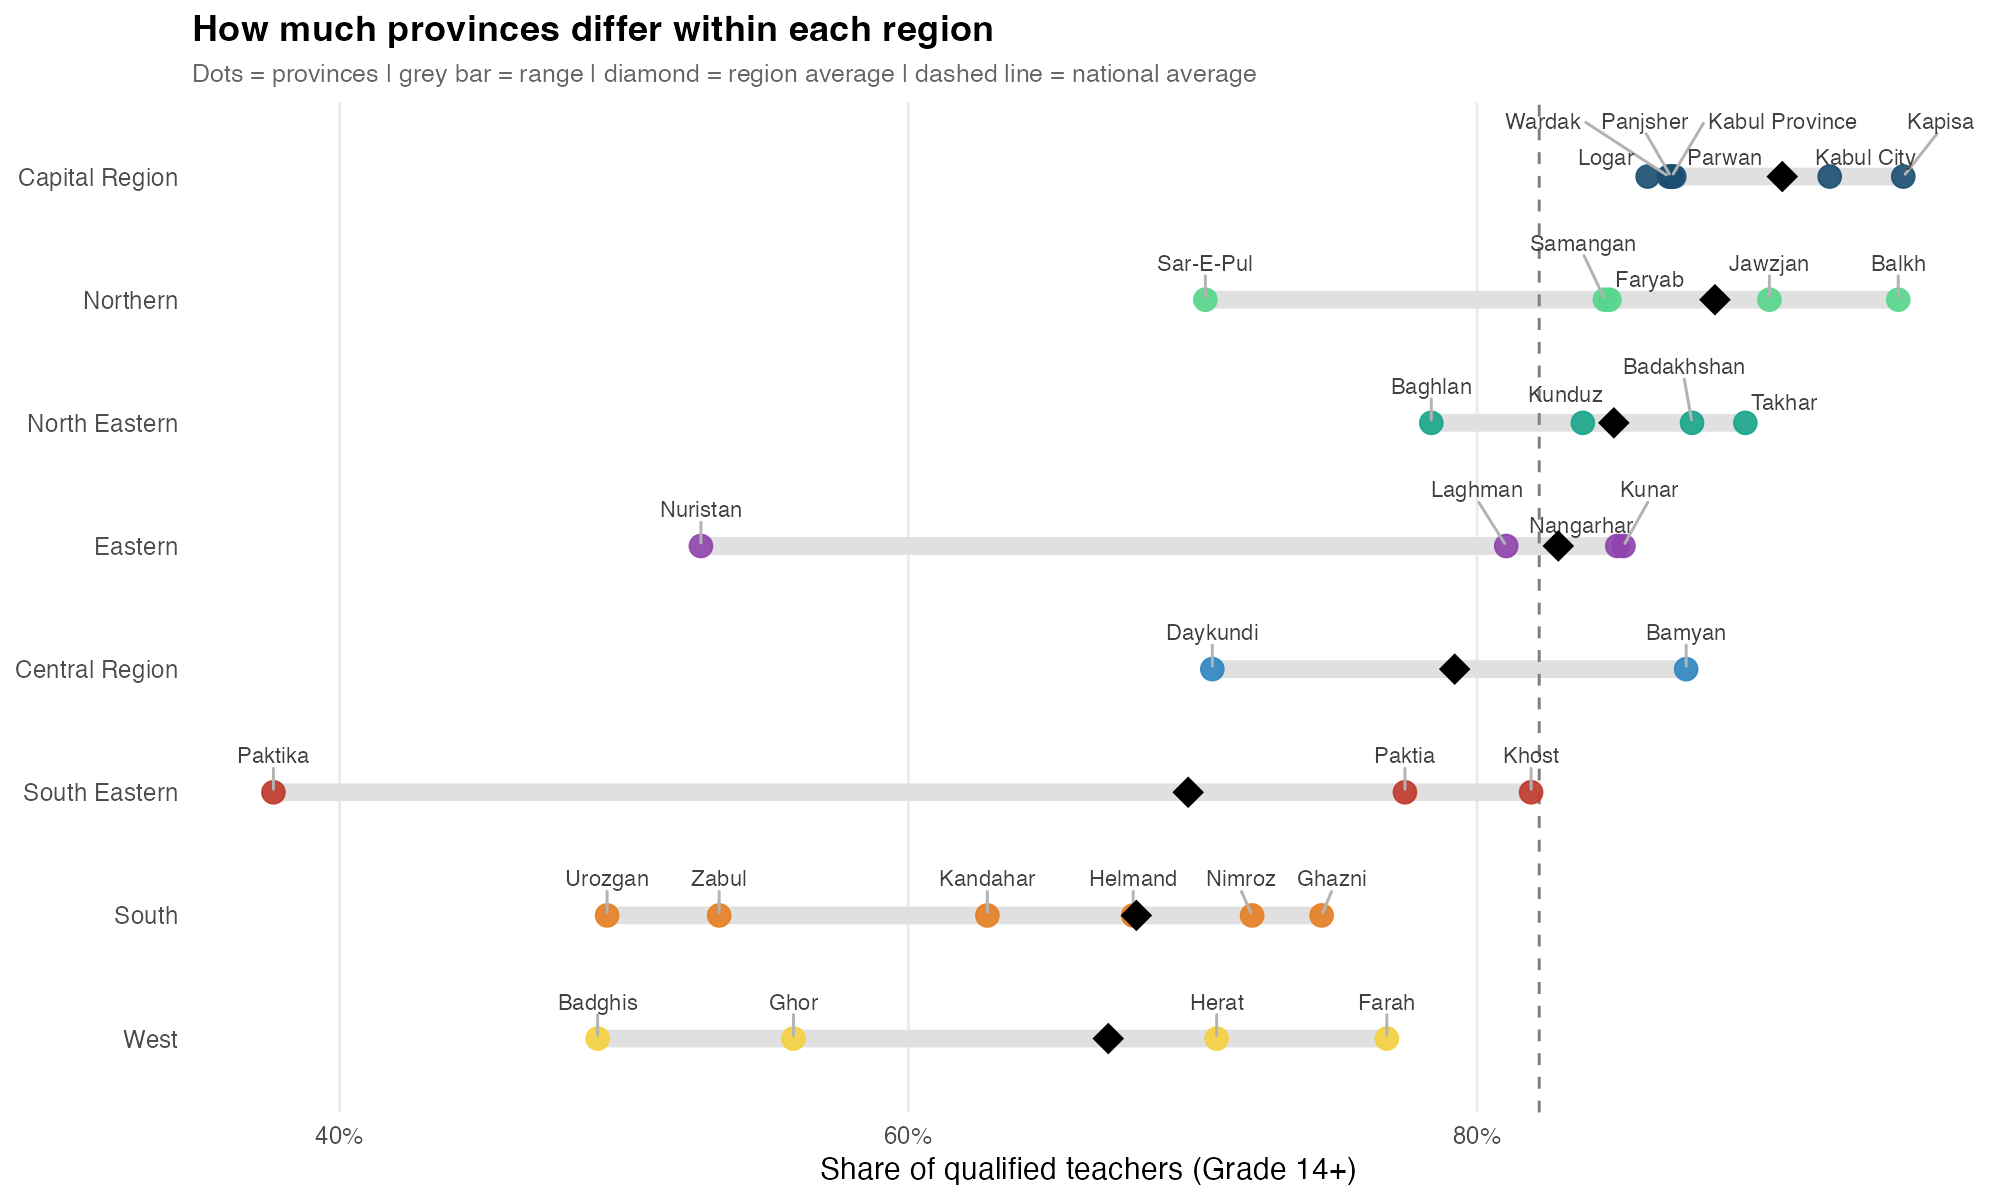
Figure 5. Differences among provinces within each region. Dots represent provinces; the grey bar shows the range; the diamond indicates the regional average; the dashed line marks the national average. Source: EMIS 2019; author’s analysis.
In several regions, one province pulls the average down: Nuristan in the East, Paktika in the South East, and Sar-e-Pul in the North.
Qualified does not mean highly educated. Provinces with similar qualified shares can have very different workforces:
Grade 14-heavy: Badakhshan (88% qualified, 11% BA), Kapisa (95%, 22%), Kunar (85%, 14%), and Nimroz (72%, 4%) meet the minimum through teacher-college graduates, with few degrees.
Degree-rich: Balkh, Jawzjan, Kabul City, and Faryab combine a high qualified share with a large BA share.
Polarised: Kandahar (36% BA, 37% unqualified), Herat (36% BA, 29% unqualified), and Khost (42% BA, 18% unqualified) have many degree holders alongside a large unqualified group.
Low on both: Nuristan, Urozgan, Badghis, Ghor, and Zabul.
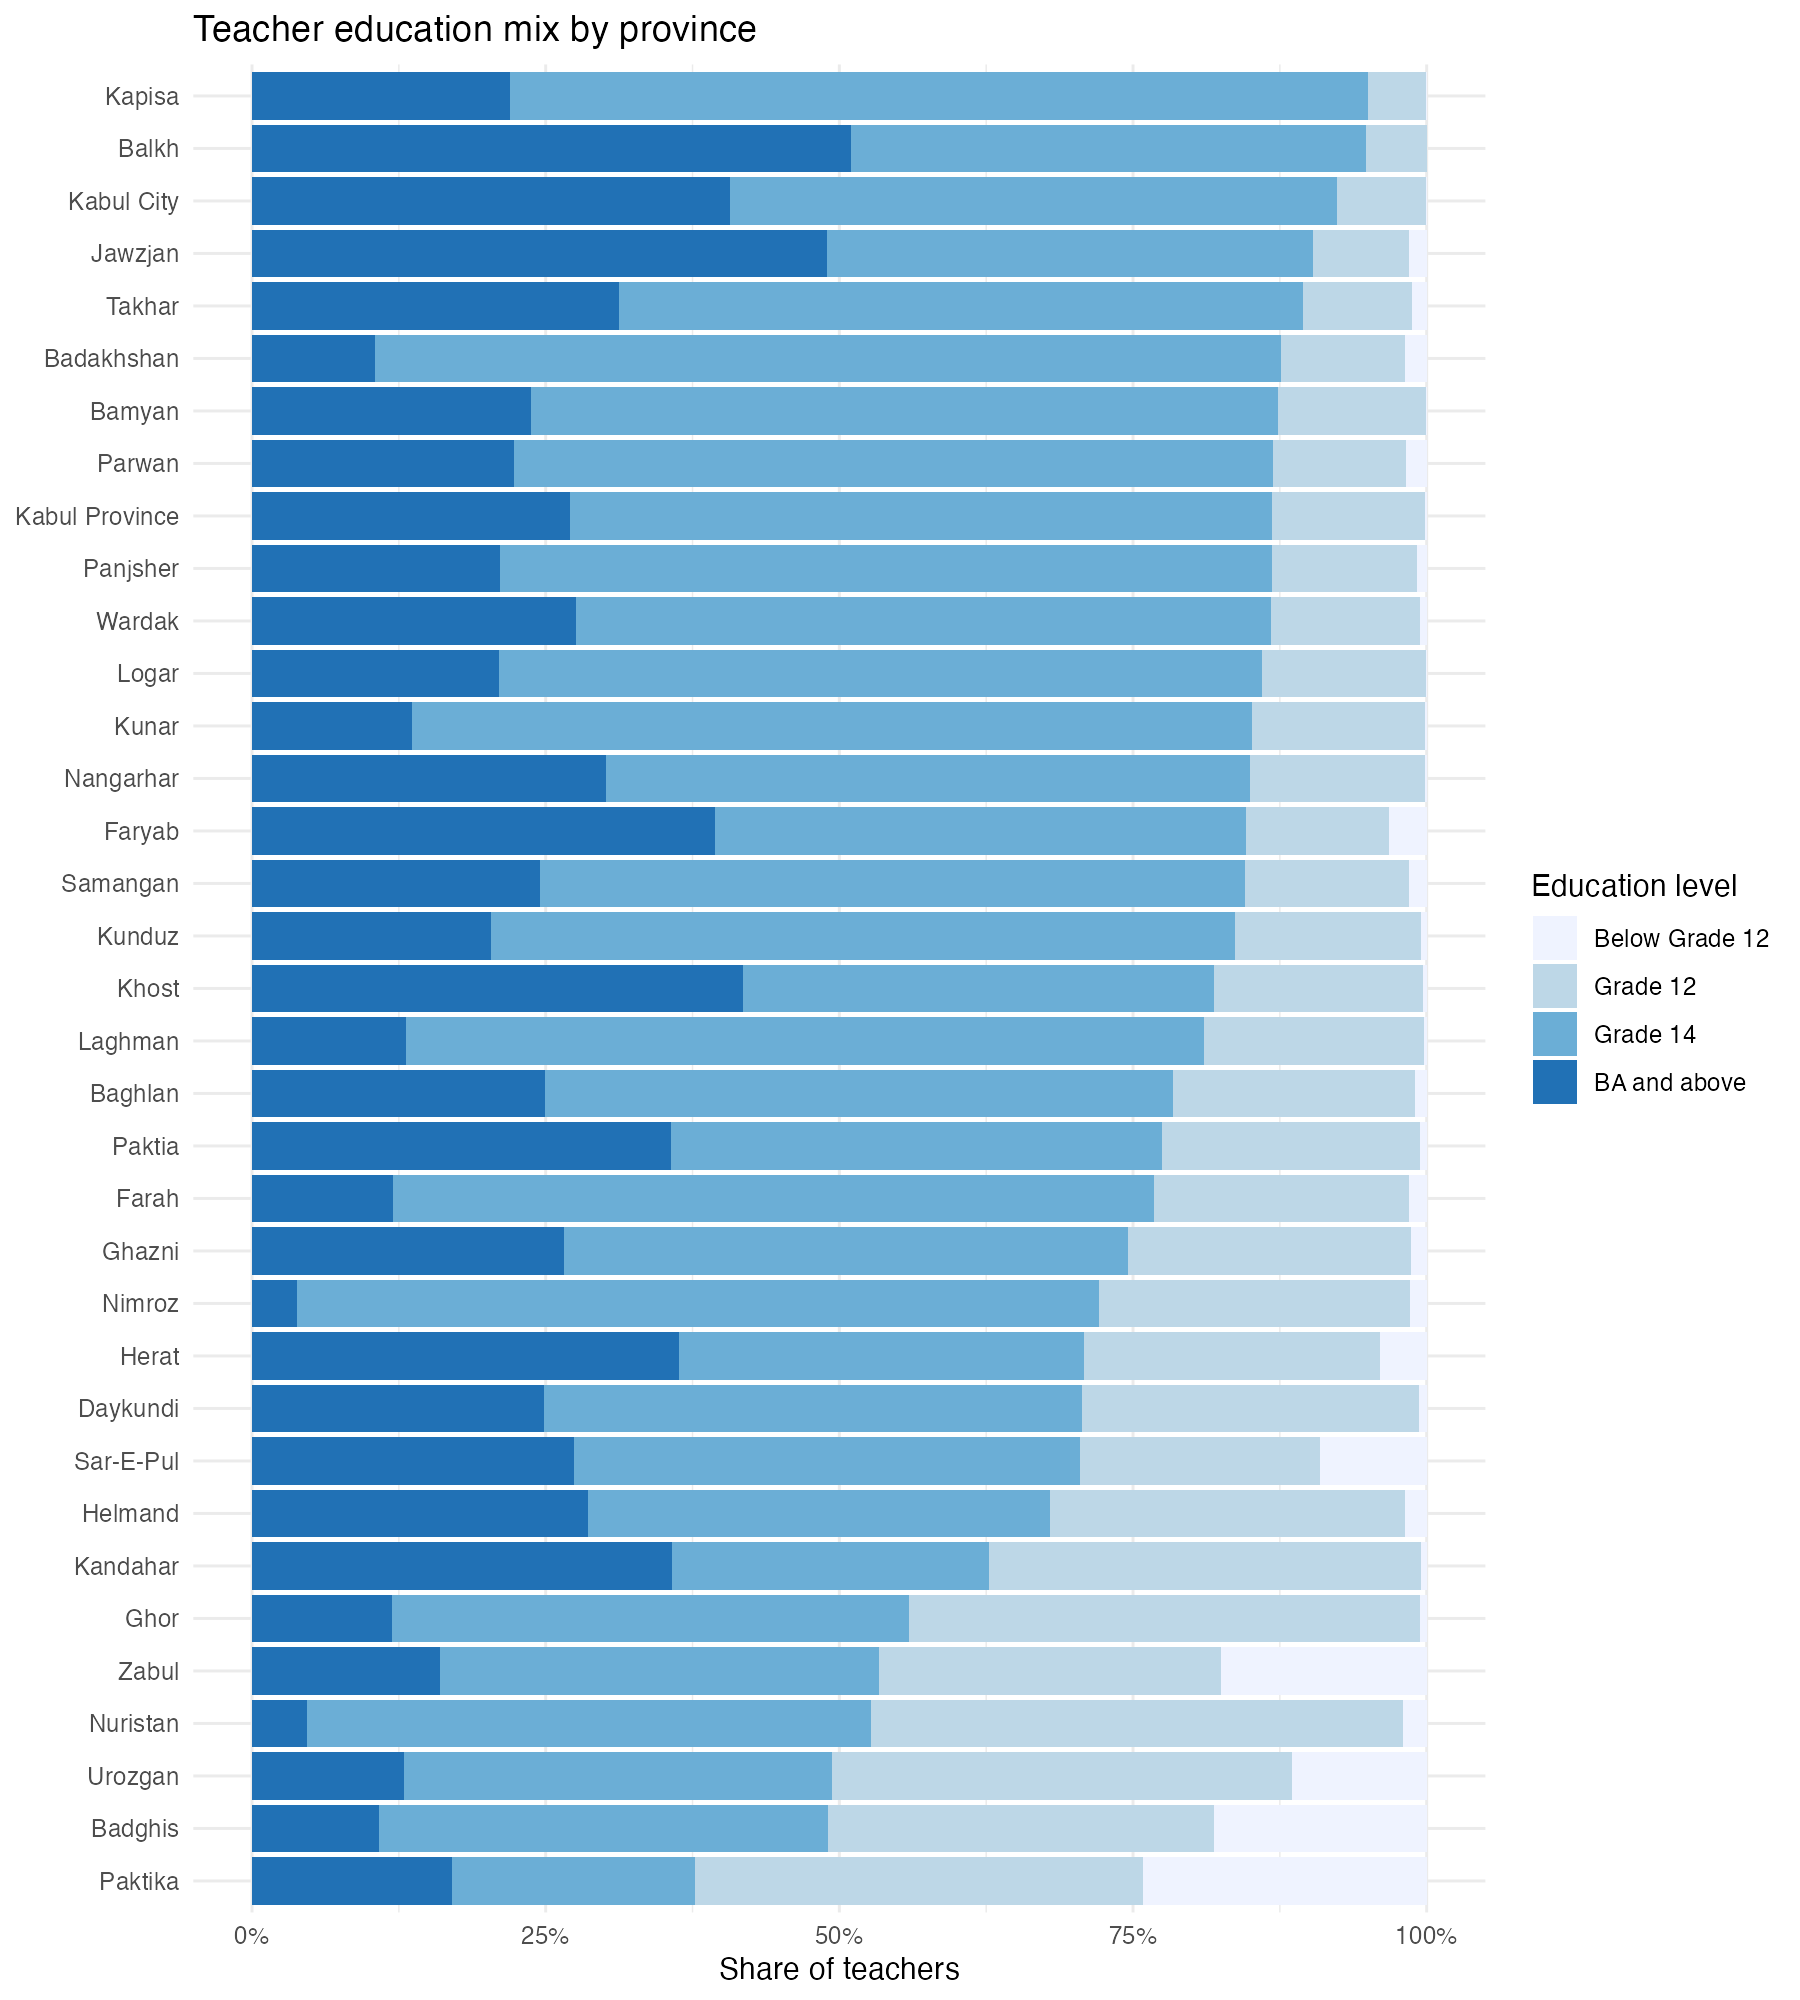
Figure 6. Teacher education mix by province, arranged by the share of qualified teachers. Source: EMIS 2019; author’s analysis.
Why national and international metrics miss this
Standard metrics report one national number, but a single number cannot show a distribution. The findings above point to four specific blind spots.
Averages are weighted by volume. Kabul City and the Capital Region account for 30% of all teachers with high qualification rates. They raise the national figure and obscure the low rates in the south and west.
A single threshold hides composition. “Share meeting the minimum” treats a Grade 14 teacher and a degree holder the same. It fails to reveal that degree-level inequality (Gini 0.266) is 2.6 times greater than minimum-level inequality (Gini 0.102).
Regional breakdowns are not enough. When sub-national figures are reported, they are often regional. However, 65% of degree inequality exists within regions, and the largest gap (Khost to Paktika, 44 points) is found within one region.
Rates alone misplace the problem. Ranking by rate highlights Paktika and Badghis. Ranking by count points to Herat and Kabul City. Each perspective obscures the other.
The implication for research and monitoring is that teacher qualification should be reported at the provincial level, by education level rather than a single threshold, and in both rates and counts.
Research agenda: where future work should concentrate
The fact base identifies where disparities exist, but it cannot explain why. These are the questions it leaves open, along with the provinces where each is most worth studying.
The first and most pressing question is why the Grade 14 mandate failed to reach the south-west belt. Paktika, Badghis, Urozgan, Zabul, and Ghor are the starting points. Possible explanations include limited access to teacher colleges, recruitment rules, insecurity, and pay. Each of these needs to be tested rather than assumed.
A second line of inquiry concerns degree holders. If they tend to stay where they trained, universities would be shaping the BA+ map. Comparing the hubs of Balkh, Herat, Kandahar, Nangarhar, and Khost with their low-BA neighbors would reveal how strong that pull is. Related to this are the polarized workforces of Kandahar, Herat, and Khost, where many degree holders work alongside a large unqualified group. The reason for their coexistence in the same province is not yet understood.
The Grade 14-heavy provinces raise a different question. Badakhshan, Kapisa, Kunar, and Nimroz achieved high coverage of the minimum with few degrees. Research should ask whether this path is a model for other provinces or a ceiling that holds them back. Similarly, the single-province outliers within otherwise stronger regions, such as Paktika in the South East, Nuristan in the East, and Sar-e-Pul in the North, call for case studies to understand what sets them apart from their neighbors.
Several dimensions lie beyond this data altogether. The most important is gender: the gaps between female and male teachers, and how those gaps vary across provinces, need their own analysis, starting in the low-rate belt. Urban–rural and school-level differences within provinces are also unknown. Time is another factor: only a series of EMIS years before and after 2019 can show whether gaps were narrowing or widening.
Finally, two questions affect how far these findings can be trusted and used. Researchers should test whether teacher qualification predicts learning outcomes at the provincial level, in provinces with comparable assessment data. They should also examine how reliable EMIS figures are at the provincial level, starting with anomalies such as Balkh’s report of no teachers below Grade 12.
Three questions are most urgent for policy. Why does the low-rate belt persist? How can we upgrade the large Grade 12 pools in Herat and Kabul City? And can degree concentration in hubs be spread to neighboring provinces?
Data caveats and limitations
This data does not distinguish female teachers, so its findings cannot be applied to them. The situation for female teachers is much more unequal, first compared to male teachers and then across provinces and regions. A gender-disaggregated analysis is needed before drawing any conclusions about them.
Institutional data, no independent verification. EMIS is reported by the education system itself, without third-party oversight or confirmation. Afghan education data has faced criticism for inconsistency for years.
One point in time. The 2019 data shows levels, not trends, so it cannot indicate whether gaps are narrowing.
A credential measure. “Qualified” only reflects formal education level. It does not account for subject match, training quality, or classroom competence.
No breakdown by gender, school level, or location. Differences within provinces on these dimensions are not visible.
Possible reporting artifact. Balkh reports zero teachers below Grade 12. This may be accurate or could result from a reporting or classification issue.
Kabul is split in two. Kabul City and Kabul Province are reported separately (35 units). On maps, they are combined into one Kabul.
Source-file issues. The source tables use inconsistent province spellings (for example, Urzugan/Urozgan, Jozjan/Jawzjan, Nanghar/Nangarhar), and one source table contains an unlabelled stray value (425,484) that does not match any total. Neither affects the figures here.
Conclusion
By 2019, after nearly two decades of policy commitment and international investment, Afghanistan seemed to have largely met its own standard for teacher qualification. More than four in five teachers held the Grade 14 minimum, a figure that is seen as success in both national and international reports. This data shows that the success was real but unevenly shared, and that the national figure concealed more than it revealed.
Beneath the average lay a systematic geography of inequality. A well-qualified north and Kabul corridor contrasted with a low-qualification belt stretching from Badghis and Ghor in the west, through Urozgan and Zabul, to Paktika in the southeast. In the weakest provinces, roughly half or more of the teachers had not reached the minimum required by national policy. The gap between the best- and worst-placed provinces was not just a matter of a few points; it represented a different system altogether.
The inequality also took two distinct forms. For minimum qualifications, it was mainly regional: entire regions in the south, southeast, and west fell behind together. For degrees, it was mainly provincial: each region had a hub of degree holders, usually around a city and a university, surrounded by areas with very few. A single national indicator, or even a regional one, cannot clearly see either pattern, and a policy based on it will miss where the problem lies.
Rates and numbers pointed to different places as well. The most severe shortfalls were in small, remote provinces like Paktika and Badghis, while the largest numbers of unqualified teachers were in Herat, Kabul City, and Nangarhar. Closing the gap requires both an equity focus on the worst-placed provinces and a scale focus on the largest pools.
These findings almost certainly understate the problem. The data does not distinguish female teachers, whose situation is far more unequal, first in relation to men and then across provinces. It measures credentials rather than teaching quality, captures a single year, and relies on institutional figures with no independent verification.
The central lesson is methodological as much as substantive. Progress in teacher qualification, and in education outcomes more broadly, cannot be judged from national averages. It must be measured at the provincial level, by level of qualification, in both rates and counts, and by gender. Until it is, the sub-national disparities that national and international metrics failed to capture will remain hidden, and policy will continue to target an average that obscures the provinces furthest behind.